private
FPoints: array [0..144] of TPoint;
{...}
procedure TForm1.CalculateGraph;
var
xRangePixels, yRangePixels: Integer;
origin: TPoint;
radian, interval: Double;
i: Integer;
begin
{
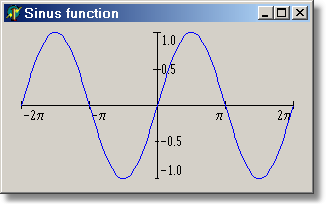
We calculate the sinus curve in the interval -2Pi..+2Pi,
with a resolution of 4Pi/144, as a series of points that
will be connected by a polyline. The graph is scaled to fit into
the paintbox. The origin of the coordinate system is the center
of the paintbox. The default windows coordinate system is inverted,
the Y axis points downward!
}
xRangePixels := (paintbox1.Width - 2) div 4; { pixels in Pi }
yRangePixels := (paintbox1.Height - 2) div 2; { pixels in 1 }
origin := Point(paintbox1.Width div 2, paintbox1.Height div 2);
radian := -2.0 * Pi;
interval := 4.0 * Pi / 144.0;
for i := 0 to High(FPoints) do
begin
FPoints[i].X := origin.x + Round(radian * xRangePixels / Pi);
FPoints[i].Y := origin.y - Round(sin(radian) * yRangePixels);
radian := radian + interval;
end;
end;
procedure TForm1.PaintBox1Paint(Sender: TObject);
var
origin: TPoint;
xRangePixels, yRangePixels: Integer;
begin
with PaintBox1.Canvas do
begin
{ Fill background in white }
Brush.Color := clBtnFace;
Brush.Style := bsSolid;
Fillrect(paintbox1.BoundsRect);
{ Paint a coordinate cross }
origin := Point(paintbox1.Width div 2, paintbox1.Height div 2);
Pen.Color := clBlack;
Pen.Style := psSolid;
Pen.Width := 1;
MoveTo(1, origin.Y);
LineTo(paintbox1.Width - 1, origin.y);
MoveTo(origin.x, 1);
LineTo(origin.x, paintbox1.Height - 1);
{ Paint some tickmarks and label the axis }
Font.Name := 'Symbol';
Font.Size := 8;
Font.Color := clBlack;
xRangePixels := (paintbox1.Width - 2) div 4; { pixels in Pi }
yRangePixels := (paintbox1.Height - 2) div 2; { pixels in 1 }
{ X axis }
MoveTo(origin.x - 2 * xRangePixels, origin.y - 4);
LineTo(origin.x - 2 * xRangePixels, origin.y + 4);
TextOut(origin.x - 2 * xRangePixels + 2, origin.y + 2, '-2p');
MoveTo(origin.x - xRangePixels, origin.y - 4);
LineTo(origin.x - xRangePixels, origin.y + 4);
TextOut(origin.x - xRangePixels + 2, origin.y + 2, '-p');
MoveTo(origin.x + xRangePixels, origin.y - 4);
LineTo(origin.x + xRangePixels, origin.y + 4);
TextOut(origin.x + xRangePixels - 2 - TextWidth('p'), origin.y + 2, 'p');
MoveTo(origin.x + 2 * xRangePixels, origin.y - 4);
LineTo(origin.x + 2 * xRangePixels, origin.y + 4);
TextOut(origin.x + 2 * xRangePixels - 2 - TextWidth('2p'), origin.y + 2, '2p');
{ Y axis }
MoveTo(origin.x - 4, origin.y - yRangePixels);
LineTo(origin.x + 4, origin.y - yRangePixels);
TextOut(origin.x + 4, origin.y - yRangePixels, '1.0');
MoveTo(origin.x - 4, origin.y - yRangePixels div 2);
LineTo(origin.x + 4, origin.y - yRangePixels div 2);
TextOut(origin.x + 4, origin.y - (yRangePixels + TextHeight('1')) div 2, '0.5');
MoveTo(origin.x - 2, origin.y + yRangePixels div 2);
LineTo(origin.x + 2, origin.y + yRangePixels div 2);
TextOut(origin.x + 3, origin.y + (yRangePixels - TextHeight('1')) div 2, '-0.5');
MoveTo(origin.x - 2, origin.y + yRangePixels);
LineTo(origin.x + 2, origin.y + yRangePixels);
TextOut(origin.x + 3, origin.y + yRangePixels - TextHeight('1'), '-1.0');
{Paint the graph }
Pen.Color := clBlue;
Polyline(FPoints);
end;
end;
procedure TForm1.FormResize(Sender: TObject);
begin
CalculateGraph;
end;
procedure TForm1.FormCreate(Sender: TObject);
begin
CalculateGraph;
end;
|
Bewerten Sie diesen Tipp:
|
|
|

